
How to Use BirdCast for Spring Birding: Alerts, Forecasts, and Live Maps Explained
Use BirdCast forecasts, live maps, alerts, and the migration dashboard for spring birding.
There is a moment that every serious spring birder knows. You wake up on an ordinary Tuesday in May, step outside, and the trees are moving. Warblers everywhere. Species you have been waiting weeks for, suddenly feeding in the shrubs at eye level, too tired from a night of flying to care about the usual distance. A fallout morning.
Those mornings are not random. They are predictable. And since 2018, a tool built by Cornell Lab of Ornithology, Colorado State University, and Purdue University has been giving birders the ability to see them coming.
BirdCast develops and maintains tools that predict and monitor bird migration, including forecast bird migration maps that predict how much, where and when bird migration will occur, live bird migration maps that show how much, where, and when migration is occurring in real-time, migration alerts to which one can subscribe to learn when intense bird migration will occur, and a dashboard that provides radar-based measurements of nocturnal bird migration at county and state levels in the contiguous US.
We use BirdCast regularly throughout spring and fall migration. This is the guide we wished existed when we started: not just what BirdCast is, but exactly how to use each tool as part of a daily decision-making system that tells you when to set an alarm, where to go, and what to look for.
What BirdCast Actually Measures
Before getting into the tools, it helps to understand what the data represents. Most birders think of migration as something that happens during the day, in the trees, in front of them. The reality is the opposite.
The vast majority of songbird migration happens at night, at altitude, invisible to anyone on the ground. A migration night over the eastern United States might move tens of millions of birds north in a single eight-hour window. By sunrise, they descend into whatever habitat is below them and begin feeding. That is the morning you see the warblers in the shrubs.
BirdCast measures this nocturnal movement using the national weather radar network. The model underlying the migration forecasts was trained on historical data and 23 years of bird movements in the atmosphere as detected by the U.S. weather surveillance radar network. By learning associations between weather variables and migration, BirdCast can use the model to predict migration intensity given a particular weather forecast.
The radar does not distinguish individual species. It measures biological targets in the air, their density, altitude, and direction of movement, and separates them from precipitation and insects using velocity and signal characteristics. The result is a continental-scale picture of how many birds are aloft, moving where, and at what intensity, updated in near real time throughout the night.
How Weather Radar Detects Birds
This is worth understanding properly because it makes the forecast maps far more readable once you know what you are looking at.
The National Weather Service operates a network of 143 NEXRAD radar stations across the contiguous United States. Each station emits pulses of microwave energy and measures what bounces back. Rain droplets bounce back at a predictable size and velocity. Birds bounce back differently: larger targets, often moving in coherent directions, primarily between sunset and sunrise.
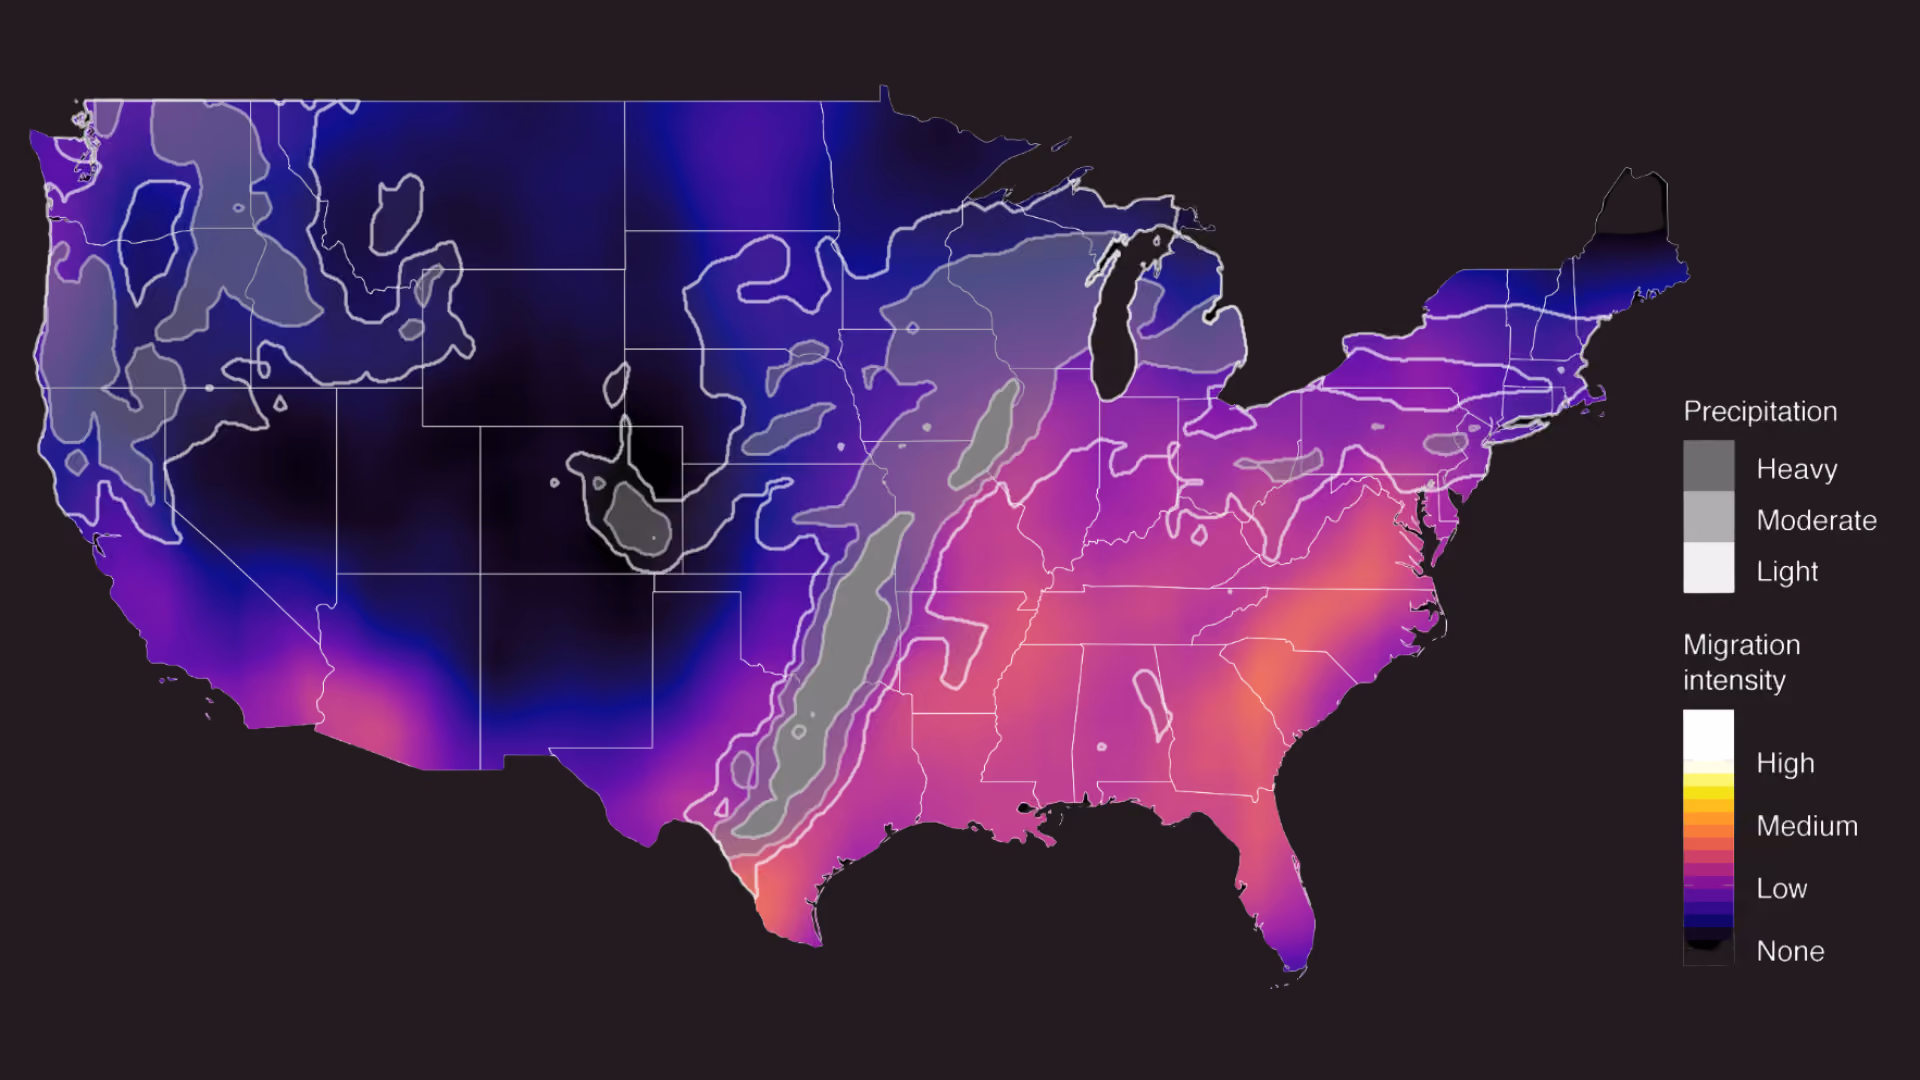
BirdCast's algorithms separate the bird signal from precipitation by analyzing target size, reflectivity, velocity patterns, and the time of day. Warmer colors on the forecast maps correspond to more intense bird migration. Maps also show areas where precipitation is expected, outlined and in grayscale. Sometimes precipitation and strong bird migration are predicted to occur simultaneously. These regions are of special interest: rain fronts can force birds to the ground, causing potentially high numbers of birds to accumulate on the ground.
That last point is critical for field birders. A front that forces migrating birds down produces what birders call a fallout, a concentration of exhausted, approachable migrants in whatever trees and shrubs are below the leading edge of the rain. BirdCast's maps show you exactly where those overlap events are likely to occur, the night before they happen.
The Four Tools and How to Use Each One
The beating heart of BirdCast remains four migration tools: forecasts, live maps, alerts, and the local migration dashboard, all back online as of March 1, 2026 for the spring season. Here is what each one does and when to use it.
1. Migration Forecast Maps
What it shows: Predicted nocturnal migration intensity for tonight, tomorrow night, and the night after. Updated every six hours.
Where to find it: birdcast.info/migration-tools/migration-forecast-maps
How to read it: The map uses a color scale from gray (no migration) through yellow, orange, and deep red (intense migration). The contiguous US is overlaid with tonight's forecast, showing where birds are expected to be in active flight approximately three hours after local sunset. Precipitation is shown in grayscale overlay. Where red migration intensity meets a precipitation boundary is your fallout zone.
Bird migration forecasts show predicted nocturnal migration approximately three hours after local sunset and are updated every 6 hours. The models predict the migration intensity for birds in active flight; these are not predictions of the numbers of birds on the ground.
The practical move: Check the three-night forecast every evening during peak spring migration weeks (late April through late May in most eastern states). If your region shows orange or red for tonight or tomorrow night, set an alarm and plan your morning accordingly. If your region is gray, use the time to check eBird for what others are reporting and plan a lighter morning.
2. Live Migration Maps
What it shows: Real-time radar-derived bird migration intensity as it is actually happening overnight, updated continuously.
Where to find it: birdcast.info/migration-tools/live-migration-maps
How to read it: Same color scale as the forecast maps, but reflecting actual radar detections rather than predictions. Watch the animation to see migration building after sunset, intensifying in the hours before midnight, and declining toward dawn as birds begin to land.
The practical move: If you wake at 3 or 4 AM during a strong migration night, check the live map before deciding whether to get up early or sleep in. A live map still showing strong intensity at 3 AM means birds are still aloft and will be landing at first light. That is your alarm. A live map that went quiet by midnight means most birds already landed and your morning window is already underway.
3. Local Migration Alerts
What it shows: Whether birds are expected to migrate through your specific city tonight, rated as low, medium, or high intensity.
Where to find it: birdcast.info/migration-tools/local-migration-alerts
How to use it: Type your city name into the alert tool. BirdCast provides live and local bird migration alerts throughout the contiguous U.S. based on a forecast model that predicts bird migration intensity from weather data. You can use this tool to determine whether birds are expected to migrate in your area tonight in low, medium, or high intensities.
The new email alert system: On March 18, 2026, BirdCast launched email migration alerts now available in 216 cities. This is the most significant BirdCast upgrade for field birders since the live maps launched. Instead of checking the website every evening, you sign up for your city and receive an email automatically when a high-intensity migration night is forecast for your area. No checking required. The alert comes to you.
To sign up, visit the Local Migration Alerts page, search your city, and look for the email subscription option on your city's alert page. If your city is not among the 216 currently supported, the closest large city in your region will serve as a reasonable proxy given how broad migration fronts are.
The practical move: Sign up for your city's email alert immediately and treat every high-intensity notification as a mandatory next-morning birding session. Medium-intensity alerts are worth a shorter visit to your closest good habitat. Low-intensity alerts on weekdays: check eBird reports from local observers and decide from there.
4. The Migration Dashboard
What it shows: A detailed county and state-level breakdown of actual nocturnal migration, including birds per kilometer per night, flight direction, altitude, and cumulative season totals.
Where to find it: dashboard.birdcast.info
How to read the metrics:
Birds per km per night is the headline number. Think of it as a measure of traffic density in the air column above your area. A reading of 500 is moderate. Above 2,000 is a significant night. The record nights BirdCast has documented have exceeded one billion birds nationally in a single evening.
Flight direction arrows show the predominant compass bearing of migration traffic. In spring, expect northeast to northwest headings across most of the eastern US. An anomalous direction on the dashboard can indicate weather disruption, birds taking detours around a pressure system, or a genuine change in the migration front.
Altitude data tells you how high birds are flying. High-altitude migration (above 1,500 meters) tends to produce less ground-level activity the following morning because birds have more control over where they land and can travel further before descending. Low-altitude migration, especially under 500 meters, often means birds are flying just above the treetops and will land quickly after sunrise in whatever habitat is immediately below them.
BirdCast's Science Center brings into one place background information on the field of radar aeroecology and the study of bird migration, including detailed insights into the peak migration periods for every county in the contiguous United States.
The practical move: Use the dashboard the morning after a strong migration night to understand what happened. If the dashboard shows 3,000 birds per km flying at low altitude on a northeast heading overnight, the habitat on the south and west sides of any woodland in your area will have been hit hardest. Birds landing after a night of northward flight concentrate at the first tree cover they encounter. Position yourself at the leading edge of forest patches facing south.
Putting It All Together: A Spring Morning Decision System
Here is the actual sequence we follow during peak spring migration:
Evening before: Check the three-night forecast map. If tonight or tomorrow shows orange or red over our region, check the local alert tool for city-level confirmation. If high-intensity is confirmed, note the precipitation overlay. Any rain boundary near our area means fallout conditions are possible.
Night of: Set an alarm 30 minutes before first light. If the live map is still active at that hour, get up. If it went quiet hours ago, sleep the extra 30 minutes but still get out early.
Morning decision: Open the dashboard for last night's county data. Check the birds-per-km number, flight direction, and altitude. Use that to decide not just whether to go, but where. High-altitude easterly flight overnight means birds came from the south and will be widely distributed. Low-altitude movement means they landed fast and will be concentrated in the first good habitat patches. Go to the habitat edge, not the interior.
In the field: Cross-reference what you are seeing with eBird's Explore page for your county. Reports filed in the last two hours tell you what other birders are finding and where. BirdCast tells you how many birds were moving. eBird tells you what species hit the ground.
The 10 Percent Rule
One piece of context that makes BirdCast genuinely useful rather than just interesting: not every night matters equally.
Research from the Cornell Lab has documented that a small fraction of migration nights account for the majority of total annual migration traffic. In practical terms, roughly 10 percent of spring nights produce conditions so favorable, southerly winds, clear skies, warm temperatures, that birds move in extraordinary numbers. The other 90 percent of nights see moderate to low traffic.
BirdCast's high-intensity alerts are your signal that you are looking at one of those rare nights. Missing a high-intensity night because you did not check the forecast is the spring birding equivalent of sleeping through a total solar eclipse. The alert system that launched March 18, 2026 exists specifically to make sure you never miss one again.
For a deeper look at what happens on the ground after a strong migration night, including which habitats concentrate birds most reliably and how to read vegetation structure for productive patches, see our guide on how to find a fallout during spring migration.
To understand the nocturnal side of what BirdCast is measuring, our guide on how to hear birds flying over at night covers the techniques for experiencing the migration BirdCast tracks, from the ground, in real time.
The Short Version
BirdCast's tools include forecast maps, live maps, local migration alerts, and a county-level dashboard, all built from weather surveillance radar data. Sign up for email alerts for your city at birdcast.info/migration-tools/local-migration-alerts. Check the three-night forecast every evening during peak spring weeks. Use the dashboard the morning after a strong night to understand where birds landed. Let the live map decide whether your alarm goes off at 4 AM.
Spring migration is already underway. BirdCast's migration tools have been live since March 1, 2026. The data is there. The alerts are free. All that is left is knowing what to do with them.